CashNews.co

Key Takeaways
-
The SPDR S&P Retail ETF remains in focus after Target, TJX Companies, and Macy’s reported earning Wednesday that showed while shoppers remain prudent, there are signs of a rebound in discretionary spending in areas such as apparel and beauty.
-
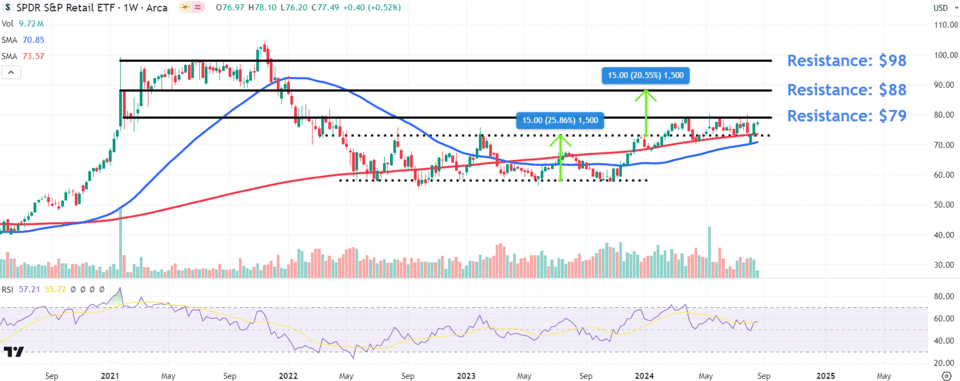
The fund briefly fell below the top trendline of a prior trading range earlier this month before making a prompt recovery to now trade comfortably above both the 50- and 200-week moving averages.
-
Investors should monitor key overhead chart levels at $79, $88, and $98.
The SPDR S&P Retail ETF (XRT) remains in focus on Thursday after sector heavyweights Target (TGT), TJX Companies (TJX), and Macy’s (M) reported earnings on Wednesday. The three retailers, which carry a cumulative weighting in the fund of around 4%, noted that while consumers remain prudent, there are signs of a rebound in discretionary spending in areas such as apparel and beauty.
The commentary backs up data last week showing a surprise improvement in retail sales during July and comes as welcome news for the group, which has grappled with consumers reigning in spending amid elevated inflation and higher interest rates.
The fund rose 1.3% to $77.49 on Wednesday. It has gained 5.6% over the last five trading sessions.
Below, we’ll zone in on XRT’s weekly chart and discuss important price levels likely to attract investors’ attention.
ETF Recovers Above Multi-Month Trading Range
XRT’s price broke out from a 22-month trading range in late February but has traded mostly sideways since on declining trading volumes, indicating ongoing accumulation.
This month’s broad-based market sell-off saw the fund briefly fall below the range’s top trendline before making a prompt recovery to now trade comfortably above both the 50- and 200-week moving averages.
Looking ahead, investors should keep their eyes on three overhead price levels of interest on XRT’s chart.
Overhead Price Levels in Focus
Firstly, it’s worth monitoring the $79 area, a location on the chart where the fund may face selling pressure near a horizontal line joining a pullback towards the completion of an impulsive move in February 2021 with multiple price peaks from March 2022 to July this year.
A breakout above this level could propel the ETF’s price up to $88, where investors may look to sell near a range of comparable trading levels over a twelve-month period between January 2021 and January 2022. Interestingly, this region also lines up with a measuring principle target when calculating the trading range’s distance in points and adding that amount to the breakout point ($15 + $73 = $88).
Ongoing buying may see the fund revisit $98, where it would likely encounter overhead resistance around the Jan 25, 2021 wide-ranging day’s high, which closely aligns with a period of price consolidation on the chart between June and August 2021.
The comments, opinions, and analyses expressed on Investopedia are for informational purposes only. Read our warranty and liability disclaimer for more info.
As of the date this article was written, the author does not own any of the above securities.
Read the original article on Investopedia.

