CashNews.co
cogal/E+ via Getty Images
The Capital Group Dividend Value ETF (NYSEARCA:CGDV) is a 1.5% yielding actively managed fund mixing mostly mega- and large-cap inexpensive, dividend-paying equities. It may venture outside dividend-paying stocks if necessary.
It seems I was a bit too pessimistic about this vehicle in my notes since January 2023. And today, I am upgrading CGDV to a Buy. There are two principal reasons for that.
- First, its performance has been unquestionably robust, as it has solidly surprised to the upside. Risk metrics (i.e., the downside capture ratio, etc.) have also been more than favorable.
- Second, the factor mix in its portfolio is supportive of CGDV outpacing the iShares Core S&P 500 ETF (IVV) going forward.
Obviously, there are risks and disadvantages. They will be given due attention below in the note.
What is CGDV’s strategy?
To recap, as it is already evident from the fund’s name, its strategy brings together two key factors: dividends and value. On its websiteit explained that CGDV:
Seeks to produce consistent income that exceeds the average yield of the S&P 500 by focusing on companies that pay dividends or have the potential to pay dividends.
In my previous note, I explained that CGDV’s approach has some flexibility when it comes to non-U.S. securities. As per page 3 of the summary prospectus:
The fund may invest up to 10% of its assets in equity securities of larger companies domiciled outside the United States.
After examining the holdings dataset provided on the CGDV website, I can conclude that as of August 14, just around 11.3% of the net assets were allocated to equities with a country code other than ‘US’ in their ISINs. At the same time, just two had a currency code other than ‘USD’ in the ‘security name’ column. They are shown below:
| Ticker | U.S. Ticker | Security Name | % Net Assets |
| BATS (London Stock Exchange) | (BTI) | BRITISH AMERICAN TOBACCO PLC COMMON STOCK GBP.25 | 2.32% |
| INGA (Euronext Amsterdam) | (ING) | ING GROUP NV COMMON STOCK EUR.01 | 1.34% |
Data from the ETF and the companies’ websites
CGDV performance: beating peers and the market
CGDV has been a massive success. This is the top reason why I am now more confident that this fund can deliver impressive returns consistently.
First, since my previous note published on December 6, 2023, CGDV has trounced the S&P 500 index, something that was exceedingly hard to achieve for most value ETFs amid the growth rotation.
Seeking Alpha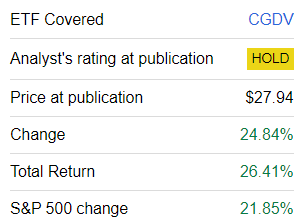
For context, the Invesco S&P 500 Pure Value ETF (RPV) and the iShares S&P 500 Value ETF (IVE) delivered materially lower total returns over the period concerned, as investors have been flocking to trendy growth stories, so old-economy modestly priced names have been struggling to keep pace with their overappreciated counterparts.
Seeking Alpha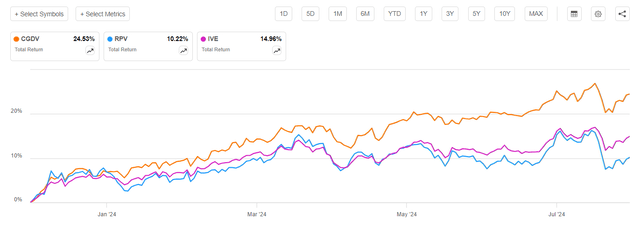
Second, over the March 2022-July 2024 period (the ETF was incepted in February 2022), CGDV’s performance was nothing short of spectacular. This dividend fund beat the market, which I usually proxy with IVV, as well as a few well-known vehicles in the dividend ETF arena, like the Schwab U.S. Dividend Equity ETF (SCHD) and the SPDR Portfolio S&P 500 High Dividend ETF (SPYD). The much smaller but still interesting Global X S&P 500 Quality Dividend ETF (QDIV) was also unsuccessful in keeping pace with it.
| Metric | CGDV | QDIV | SCHD | SPEAR | IVV |
| Start Balance | $10,000 | $10,000 | $10,000 | $10,000 | $10,000 |
| End Balance | $14,486 | $11,266 | $11,719 | $11,368 | $13,102 |
| CAGR | 16.57% | 5.05% | 6.79% | 5.45% | 11.83% |
| Standard Deviation | 17.75% | 17.74% | 16.50% | 20.42% | 18.45% |
| Best Year | 28.80% | 9.63% | 10.47% | 12.45% | 26.32% |
| Worst Year | -4.83% | -2.31% | 1.45% | -2.76% | -11.02% |
| Maximum Drawdown | -20.51% | -16.50% | -14.18% | -19.30% | -20.28% |
| Sharpe Ratio | 0.73 | 0.14 | 0.23 | 0.16 | 0.48 |
| Sortino Ratio | 1.17 | 0.2 | 0.36 | 0.24 | 0.72 |
| Benchmark Correlation | 0.93 | 0.87 | 0.85 | 0.81 | 1 |
| Upside Capture | 101.66% | 72.88% | 71.61% | 79.75% | 100% |
| Downside Capture | 84.71% | 92.97% | 84.51% | 99.95% | 100% |
Data from Portfolio Visualizer
It is worth noting that the downside capture ratio was one of the smallest in the group (only SCHD did slightly better), while the upside capture ratio was the strongest.
Additionally, I suppose it would also be pertinent to mention that CGDV beat IVV in 16 calendar months out of the full 29 it has in the books.
Created by the author using data from Portfolio Visualizer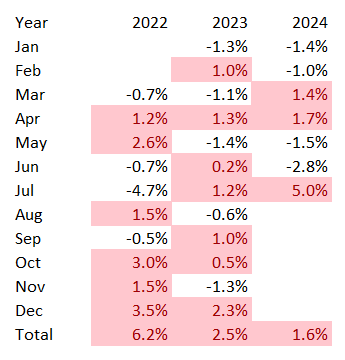
Why has CGDV surprised to the upside?
Next, it is worth investigating why CGDV has significantly outperformed the market since the previous note. Its portfolio has not changed much as only 8 stocks were removed (for instance, Intel (INTC), which has been through the wringer recently, so steering clear of it made sense) and 9 were added (like Capital One Financial Corporation (COF), which now has 2.1% weight). It is interesting that CGDV replaced one energy supermajor with another, as it welcomed Exxon Mobil (XOM) and jettisoned Chevron (CVX).
So, after examining price returns (based on the share prices as of December 5, 2023, and August 15, 2024), I can conclude that the stock choices it made in the communication and IT sectors were the key contributors to its impressive performance. To corroborate, communication had an average return of approximately 46.3%, while IT delivered 35.7%. Energy and materials were more of a disappointment, with 7.4% and 6.5%, respectively, yet this did not hinder CGDV from outpacing the market.
CGDV factor mix
In the current iteration, there are 51 equities in CGDV’s portfolio. Little has changed since December 4 when it held 50 equities. It still ignores the real estate sector completely. Regarding other sectors, it is worth noting that CGDV has trimmed its exposure to IT while adding more financials, as illustrated by the table that I have prepared using data from the fund and the iShares Core S&P Total U.S. Stock Market ETF (ITOT).
Created by the author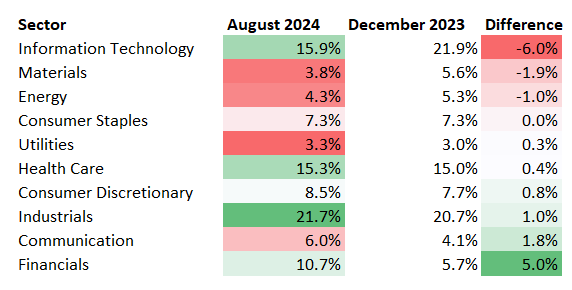
Value factor
By mega-cap standards, CGDV delivers compelling exposure to the value factor, as illustrated by its adjusted earnings yield, EV/EBITDA, and Price/Sales. Certainly, it has a too small allocation to stocks with a B- Quant Valuation grade or higher, but, alas, investing in high-quality bellwethers requires some compromises.
| Metric | IVV | CGDV, August 2024 | CGDV, December 2023 |
| Market Cap | $954.42 billion | $551.57 billion | $400.82 billion |
| P/S | 8.29 | 4.78 | 4.44 |
| EV/EBITDA | 23.56 | 17.33 | 15.21 |
| Adjusted EY | 3.85% | 4.10% | 5.27% |
| Quant Valuation B- or higher | 7.1% | 14.4% | 11.9% |
Calculated by the author using data from Seeking Alpha and the ETFs
Growth
Growth is its Achilles heel. And this is something I dislike about CGDV.
| Metric | IVV | CGDV, August 2024 | CGDV, December 2023 |
| EPS Fwd | 17.84% | 9.71% | 7.48% |
| Revenue Fwd | 11.90% | 5.25% | 7.93% |
| EBITDA Fwd | 19.66% | 9.45% | 5.36% |
| Quant Growth B- or higher | 40.9% | 28.44% | 32% |
Calculated by the author using data from Seeking Alpha and the ETFs
As illustrated by the data above, IVV beats it both in terms of weighted-average growth rates and exposure to stocks with a B- Growth grade or better.
Quality
CGDV’s profitability and capital efficiency characteristics remain robust, as illustrated by the metrics below.
| Metric | IVV | CGDV, August 2024 | CGDV, December 2023 |
| LONG | 14.18% | 8.13% | 9.25% |
| Adjusted ROE | 20.27% | 18.89% | 21.64% |
| Quant Profitability B- or higher | 94.77% | 91.38% | 91.88% |
Calculated by the author using data from Seeking Alpha and the ETFs
However, the S&P 500 ETF is a bit ahead both in terms of capital efficiency and exposure to stocks with strong B- Profitability ratings or higher.
Dividends
Dividend matters should be addressed separately. First and foremost, CGDV is clearly not about high-yield exposure. It is not designed to maximize income by holding the most generous payers, irrespective of their fundamentals. Rather, it is about sound, durable dividend stories with adequate yields, as illustrated by the Quant data that I have compiled below.
| Quant Grade (B- or higher) | December 2023 | August 2024 |
| Dividend Consistency | 62.1% | 56.6% |
| Dividend Safety | 76.4% | 68.5% |
| Dividend Yield | 36.3% | 33.1% |
Since December, as a direct consequence of capital appreciation, the weighted-average dividend yield of CGDV’s portfolio has inched lower. However, it is still confidently higher than that of IVV, which stands at 1.3%, as per my calculations. In my December article, I emphasized that the tobacco industry was the top contributor to the yield. It is still so, but to a lesser extent, as Altria (MO) has been removed since then. However, 10.1% yielding BTI has retained its place in the portfolio. Without this stock, the WA yield would be 24 bps lower.
| Portfolio as of | DY | Div Growth 3Y | Div Growth 5Y |
| December 2023 | 2.18% | 10.97% | 6.44% |
| August 2024 | 1.95% | 11.30% | 6.43% |
Calculated by the author using data from Seeking Alpha and the ETF
At the same time, the WA 3Y dividend CAGR has risen a bit. Though not outstanding, these growth rates are healthy, assuming they are backed by the impressive quality characteristics of this portfolio.
The ETF itself has also seen an encouraging trend in distributions since its inception.
Created by the author using data from Seeking Alpha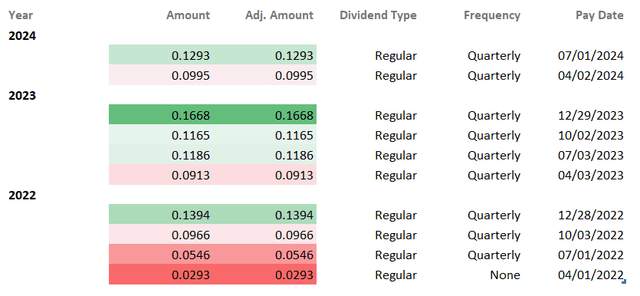
Final thoughts
CGDV is a solid, active ETF with $9.83 billion in net assets and an expense ratio of 33 bps. I am now convinced that the fund will be capable of consistently outmaneuvering the market going forward. I believe its combination of value and quality should work well in the current market environment. For clarity, assuming investors are awaiting interest rate cuts, there is no need to maximize value exposure (i.e., seek earnings yields north of 6%, etc.).
However, this vehicle is not without vulnerabilities. First, the key disadvantage is its rather low dividend yield. In this regard, CGDV is certainly a pass for high-yield investors. Second, I would not say its growth characteristics are appealing. There is no doubt that it is counterintuitive to demand double-digit revenue and EPS growth rates from a portfolio built around a concept of value. And CGDV has already proved that it is capable of outpacing the market even with modest growth factor exposure. Yet, I nonetheless should highlight this as a risk investors should consider carefully in case they want to maximize their profits from growth rotation and the end of restrictive monetary policy. However, I believe that on other fronts, CGDV scores excellently and deserves an upgrade.

