CashNews.co
PM Images
Introduction
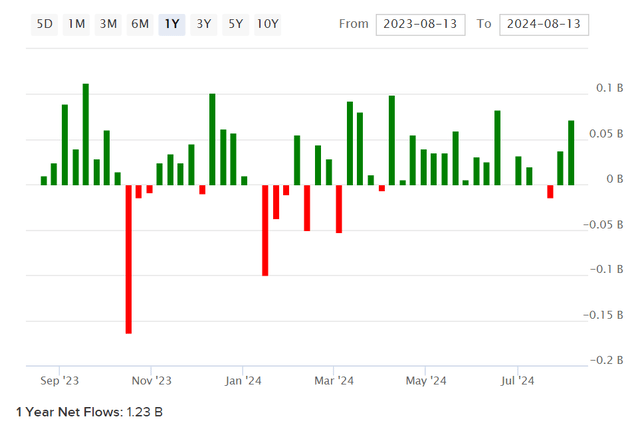
iShares Core S&P U.S. Growth ETF (NASDAQ:IUSG) is an exchange-traded fund that is designed to replicate its chosen benchmark, the S&P 900 Growth Index. The most recent benchmark index fact sheet, as of July 31, 2024, indicated 483 constituents, which matches the number of holdings in IUSG as of August 13, 2024. Net assets under management were $18.6 billion, making the fund reasonably popular, and this follows positive net fund flows of about +$1.23 billion over the past year (as illustrated below).
ETFDB.com
IUSG’s expense ratio is reported at 0.04%, which is competitive, and given the popularity of the fund, the 30-day median bid/ask spread is also inexpensive at just 0.03%. Therefore, IUSG is cheap to transact with and hold over the long haul.
It has been a while since I covered IUSG; the last time was back in November 2021. I took an optimistic view, but the fund has actually underperformed the S&P 500 index since then, with a change of +8.90% versus the S&P 500’s larger move upward of +16.03%. Since then, much has changed, and my own method of valuing ETFs has become more detail-oriented. Therefore, I think it makes sense to revisit IUSG, especially as other U.S. equity funds seem to offer good value based on my recent analysis, at recent prices.
Portfolio
The earlier cited benchmark index from the S&P’s most recent fact sheet, in July 2024, provides an adequately straightforward description of IUSG’s portfolio construction:
The S&P 900 Growth measures constituents from the S&P 900 that are classified as growth stocks based on three factors: sales growth, the ratio of earnings change to price, and momentum.
In a sense, IUSG’s portfolio is constructed (and rebalanced roughly quarterly, if/as necessary) to build a growth-oriented portfolio, but with a greater overall level of diversification than many other growth funds. Many other funds will purposefully limit themselves to, say, the S&P 100, or the Nasdaq-100. The S&P 900 Growth picks out the companies with higher sales growth, earnings growth, and momentum. However, looking at the methodology (page 6 of 31) in a bit more detail, the earnings growth factor is defined as follows:
Three-Year Net Change in Earnings per Share (Excluding Extra Items) over Current Price
I can’t help but think this introduces some methodological error, since for example if you were to take two fast-growing companies (by earnings), one with a higher current stock price would be given a lower growth score than the other. So, the construction sort of implicitly might start to over-weight companies with lower stock prices, confusing growth with value albeit indirectly. Since IUSG is also going to include momentum stocks too, perhaps this is evened out somewhat, but the methodology does not seem especially sound to me. Some “noise” is likely going to result in some fairly subjective picks. Nevertheless, with almost 500 holdings, there is not an awful lot of selection happening; IUSG is therefore going to often likely reflect many other mega- and large-cap U.S. equity funds.
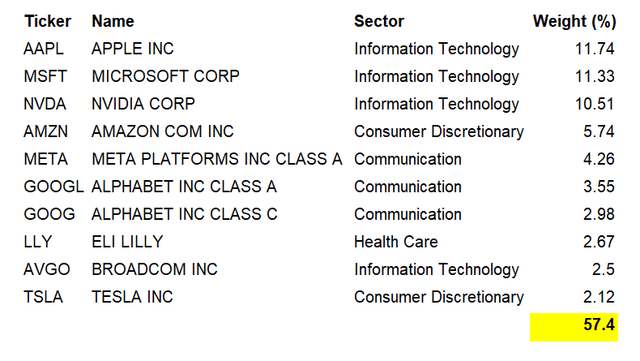
The current portfolio’s top 10 holdings, as a testament to the above, include some household names, like Apple Inc. (AAPL), Microsoft Corporation (MSFT), NVIDIA Corporation (NVDA), Amazon.com, Inc. (AMZN), Meta Platforms, Inc. (META), Alphabet Inc. (GOOGL) (GOOG) and Tesla, Inc. (TSLA). The concentration in these top 10 names is 57.4%, which is considerable.
Data from iShares.com
Given the portfolio construction, IUSG is mostly a “beta” fund. It is a fund perhaps better characterized by what it does not include, rather than by its mandate. That is, IUSG is going to exclude companies with either slow/stable earnings or otherwise high stock prices relative to trailing earnings, low or stable sales growth, and/or below-average momentum. I would imagine that the momentum factor is likely pulling most of the weight in the strategy, here.
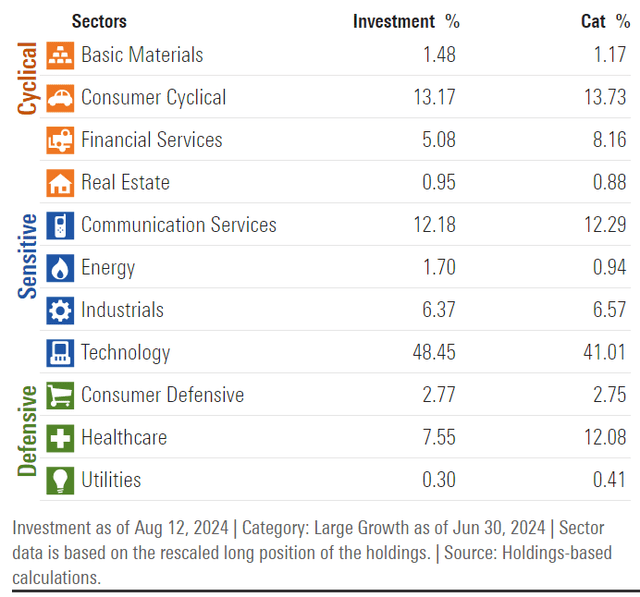
As for sectors, beyond the Technology exposure (at 48.45%, which is unsurprisingly but worth noting), other key sectors include Consumer Cyclical (13.17%), and Communication Services (12.18%, which will actually include even more tech, such as Meta Platforms and Alphabet).
Morningstar.com
To me, IUSG is essentially another U.S. tech fund. If the portfolio construction happens to result in a happier IRR projection, the expense ratio and low bid/ask spread make it a long-term opportunity. Otherwise, I see nothing special about this fund in its construction; if anything, it might introduce some level of statistical noise in its fairly subjective way of defining “growth”.
Valuation
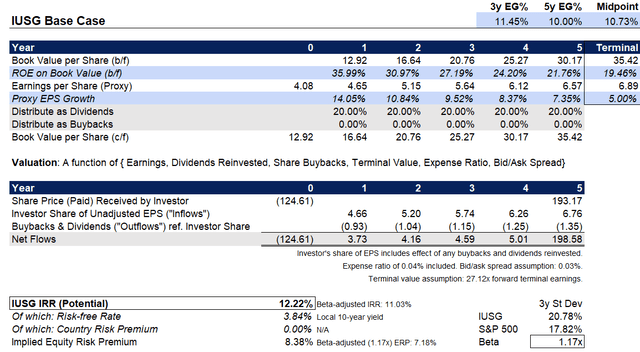
We can start by basing our earnings expectations on the near-term consensus as well as trailing figures, as reported by S&P themselves, with the most recent fact sheet for IUSG’s benchmark (cited earlier). As of July 31, 2024, the trailing and forward price/earnings ratios were 30.93x and 27.12x, respectively, with a price/book ratio of 9.76x and an indicative dividend yield of 0.67%. These figures imply a forward return on equity of 35.99%, helped in great part by some of the largest holdings (as I mentioned in a recent article covering IOO, a fund that also includes some top names like Apple; I mentioned the kinds of high returns on equity of these businesses).
Meanwhile, three- to five-year average earnings growth is expected to be 15.86% as indicated by Morningstar’s consensus. I think this is probably a little optimistic considering the unadjusted EPS growth expectation implied by S&P’s numbers comes to 14.05% (if we compare the trailing and forward price/earnings ratios). Therefore, I am going to assume a lesser average of about 10% over five years, as a starting point. Although this is still a high figure, it does imply a significant drop in the underlying return on equity, from about 36% (as noted above) in year one, down to about 19.5% in year six.
Holding most other factors constant, the IRR implied by these figures, which are a little under the consensus it seems, comes to over 12%. This is actually one of the highest figures I have seen recently for these more “beta-centric” funds. While it might be by chance, it does make IUSG prospectively and comparably very interesting at present prices.
Author’s Calculations
A risk to this setup might be a sharp recession, but it is difficult to see how these kinds of businesses (which are often cash-rich, like Apple Inc.) would struggle more than average in that kind of macro environment. Larger businesses tend to have more pricing power, and with less average net debt (if not net cash), they tend to be able to see through harder times. Lower interest rates also tend to support ‘growth stock’ valuations. My below-consensus estimate of IUSG’s potential, as above, implies a very high equity risk premium already, at 8.38% (or 7.18%, if we adjust for the fund’s 1.17x beta).
A fair equity risk premium for U.S. ETFs is circa 3.2-5.5%, depending on the market regime. This would suggest that, if anything, markets are currently risk-averse. While we might have seen significant run-ups in stocks like NVDA, which form part of this portfolio, on a market-wide basis, these kinds of valuations absolutely do not scream “bubble” to me.
IUSG may be historically more volatile than the broader market, and indeed more of a long-beta fund than an opportunity for “alpha” at first glance, it is difficult not to see that IUSG offers some opportunity for alpha/out-performance at present prices. What I would say, as a note of caution, is that the downside beta I calculate on a three-year, monthly basis as being 1.22x, versus the upside-only beta of 1.12x. Therefore, IUSG has the potential for some “negative skewness” should markets decide to crash (for whatever reason, including for presently unknown factors). Therefore, while current valuations look cheap to me, one should be prepared to accept a higher-than-average level of risk before investing in IUSG. Again, this is likely owing to the pro-momentum aspect of the fund’s selection methodology.

